


Gold trading is grabbing headlines as price swings reach new highs and traders hunt for that next big move. Here’s something that catches most people off guard. Research shows that when traders combine indicators like RSI and MACD, accuracy in forecasting gold prices can jump by over 30 percent compared to using a single tool. But relying on just one indicator could leave traders exposed to sudden reversals and missed signals. The real edge comes from blending multiple strategies and reading the signals that others overlook.
Table of Contents
- Key Technical Indicators For Gold Prices
- How To Use Indicators For Gold Signals
- Popular Strategies With Gold Indicators
- Tips For Beginners In Gold Trading
Quick Summary
| Takeaway | Explanation |
|---|---|
| Utilize Key Technical Indicators | The Relative Strength Index (RSI), Moving Average Convergence Divergence (MACD), and Money Flow Index (MFI) are essential tools for analyzing gold market trends and making informed trading decisions. |
| Implement Robust Signal Generation Strategies | Combining multiple indicators, such as RSI and MACD, enhances the reliability of trading signals by identifying convergence and divergence patterns for strategic entry and exit points. |
| Prioritize Risk Management | Set strict stop-loss orders and ensure that risks on individual trades do not exceed 1-2% of total capital to protect against significant losses in the volatile gold market. |
| Adopt a Continuous Learning Approach | Beginners should practice on demo accounts, keep a trading journal, and stay informed about global economic events to refine their trading strategies and enhance confidence. |
| Focus on Trend Reversal Techniques | Identifying bullish and bearish divergences between price action and RSI can signal potential trend changes, allowing traders to prepare for significant movements in the gold market. |
Key Technical Indicators for Gold Prices
Trading gold requires sophisticated analytical tools that help traders make informed decisions in a complex and volatile market. Technical indicators serve as critical navigational instruments for understanding price movements, market sentiment, and potential trading opportunities in the gold market.
Understanding Technical Indicator Fundamentals
Technical indicators are mathematical calculations based on historical price, volume, and open interest data that provide traders with insights into potential market trends and price movements. In gold trading, these indicators help traders identify entry and exit points, assess market momentum, and predict potential price reversals.
A groundbreaking research study from 2024 emphasized the critical role of specific technical indicators in gold price forecasting. The study highlighted key indicators that consistently demonstrate high predictive accuracy and reliability for XAU/USD trading.
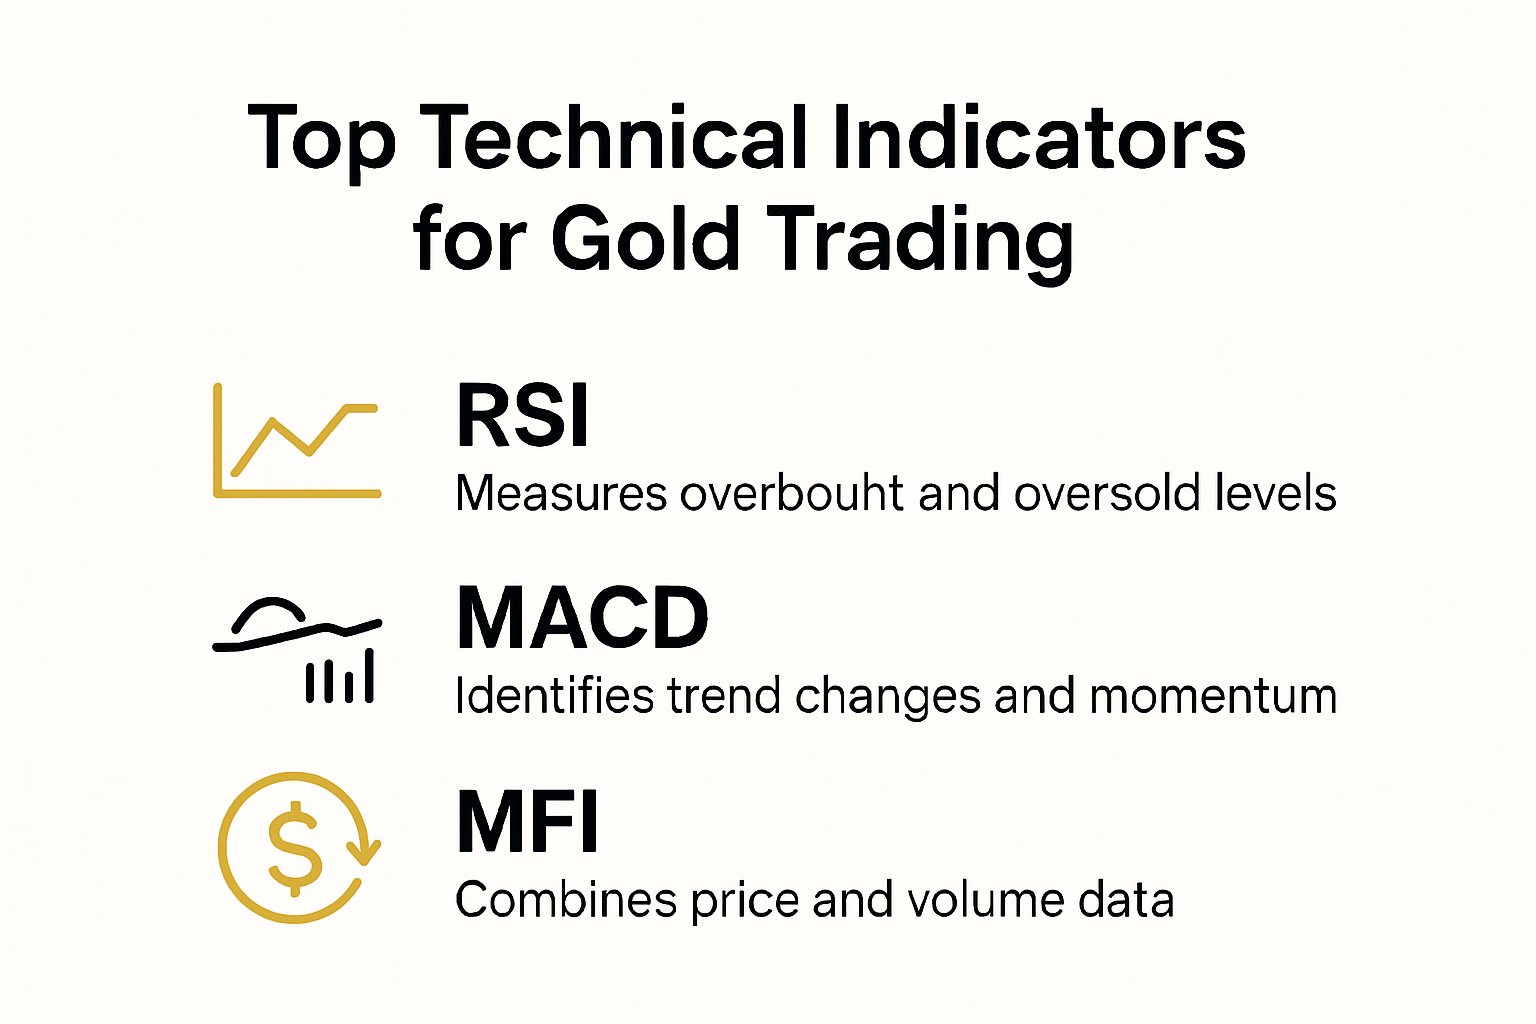
Top Technical Indicators for Gold Trading
Traders rely on several powerful technical indicators to navigate the gold market effectively. According to the machine learning framework developed in 2025, integrating multiple financial indicators can significantly enhance predictive capabilities.
Relative Strength Index (RSI)
The RSI is a momentum oscillator that measures the speed and change of price movements. For gold trading, RSI helps identify overbought and oversold conditions. When the RSI moves above 70, it suggests the gold market might be overbought, indicating a potential price correction. Conversely, an RSI below 30 suggests the market might be oversold, presenting a potential buying opportunity.
Moving Average Convergence Divergence (MACD)
MACD is a trend-following momentum indicator that shows the relationship between two moving averages of a security’s price. In gold trading, MACD helps traders identify trend changes and momentum shifts. When the MACD line crosses above the signal line, it generates a bullish signal, suggesting potential price increases. When it crosses below, it indicates a bearish trend.
Money Flow Index (MFI)
The MFI combines price and volume data to measure buying and selling pressure. For gold traders, this indicator helps assess the strength of price trends and potential trend reversals. A high MFI indicates strong buying pressure, while a low MFI suggests selling pressure.
Learn more about advanced gold trading strategies that can help you maximize your trading potential.
A 2023 research publication introduced innovative approaches like fractals and Triangular Moving Average Centered Bands, demonstrating the continuous evolution of technical analysis in gold trading.
Successful gold trading requires a comprehensive approach that combines multiple technical indicators, fundamental analysis, and a deep understanding of market dynamics. By mastering these tools, traders can develop more robust and informed trading strategies.
To help you quickly compare the main technical indicators described above, here’s a summary table outlining their features and primary uses.
| Indicator | Type | Main Purpose | Key Signal |
|---|---|---|---|
| RSI | Momentum Oscillator | Identifies overbought/oversold conditions | RSI > 70: Overbought, RSI < 30: Oversold |
| MACD | Trend-Following Momentum | Detects trend changes/momentum shifts | Bullish when MACD > Signal; Bearish when MACD < Signal |
| MFI | Volume-Based Oscillator | Assesses buying/selling pressure, trend strength | High MFI: strong buying, Low MFI: strong selling |
How to Use Indicators for Gold Signals
Navigating the gold trading landscape requires more than just knowing technical indicators. Traders must understand how to strategically apply these tools to generate reliable trading signals and make informed decisions in the dynamic XAU/USD market.
Signal Generation Strategies
Effective signal generation involves combining multiple technical indicators to create a robust trading approach. As research from Wikipedia suggests, oscillators like the Commodity Channel Index (CCI) play a critical role in identifying potential market entry and exit points.
Traders should focus on convergence and divergence between different indicators. For instance, when the Relative Strength Index (RSI) shows an oversold condition simultaneously with the Moving Average Convergence Divergence (MACD) indicating a bullish trend, it creates a stronger signal for potential trading opportunities.

Advanced Indicator Confirmation Techniques
Confirmation is key in reducing false signals. Research from ArXiv highlights the importance of combining momentum indicators to improve trading performance. Traders can implement a multi-step verification process:
- Cross-Indicator Validation: Compare signals from different indicators to ensure consistency
- Timeframe Analysis: Verify signals across multiple timeframes for increased reliability
- Volume Confirmation: Use volume indicators to support price movement signals
Explore advanced gold trading signal strategies to enhance your trading approach.
Bollinger Bands and Volatility Tracking
Wikipedia’s analysis of Bollinger Bands provides insights into tracking market volatility. These bands help traders identify potential price breakouts and consolidation periods. When the price moves close to the upper or lower bands, it indicates potential trend reversals or continuation patterns.
Successful gold trading requires a nuanced approach that combines technical analysis, risk management, and continuous learning. Traders should practice using indicators in simulated environments, continuously refine their strategies, and remain adaptable to changing market conditions.
Remember that no single indicator guarantees success. The key is to develop a comprehensive trading system that incorporates multiple technical tools, fundamental analysis, and a disciplined approach to risk management.
Popular Strategies with Gold Indicators
Trading gold successfully requires more than just understanding individual technical indicators. Traders must develop sophisticated strategies that leverage multiple indicators to maximize potential profits and minimize risks in the volatile XAU/USD market.
Momentum-Based Trading Strategies
Momentum trading strategies focus on identifying and capitalizing on strong price trends in gold markets. According to research from ArXiv, combining momentum indicators can significantly improve trading performance. Traders typically use a multi-indicator approach that includes the Relative Strength Index (RSI), Moving Average Convergence Divergence (MACD), and Money Flow Index (MFI).
A powerful momentum strategy involves looking for confluence between different indicators. For instance, when the MACD shows a bullish crossover, the RSI indicates an oversold condition below 30, and the MFI suggests strong buying pressure, traders can identify a high-probability trading opportunity.
To clarify how different strategies leverage various indicator combinations and signal types, the table below summarizes the three most popular gold trading strategies and their key characteristics.
| Strategy Type | Indicator Combination | Primary Signal Focus | Example Setup |
|---|---|---|---|
| Momentum-Based | RSI + MACD + MFI | Trend strength & direction | Bullish MACD cross & RSI < 30 with rising MFI |
| Volatility-Based Breakout | Bollinger Bands + Volume | Breakouts & volatility changes | Price breaks above upper band with volume spike |
| Trend Reversal/Confirmation | RSI Divergence + Price Action | Early reversal detection | Price lower lows + RSI higher lows (bullish divergence) |
Volatility-Based Breakout Strategies
Analysis from GoldSniper VIP highlights the effectiveness of Bollinger Bands in identifying market volatility and potential breakout opportunities. Traders can develop strategies around these volatility bands by:
- Identifying price movements outside the upper or lower Bollinger Bands
- Confirming breakouts with volume and other momentum indicators
- Setting precise entry and exit points based on band expansions and contractions
Explore advanced gold scalping techniques to enhance your trading approach.
Trend Reversal and Confirmation Techniques
Successful gold trading requires a nuanced approach to identifying potential trend reversals. Traders can use divergence techniques between price action and technical indicators. The RSI analysis from GoldSniper VIP demonstrates how divergences can signal potential trend changes:
- Bullish Divergence: When price makes lower lows, but the RSI makes higher lows
- Bearish Divergence: When price makes higher highs, but the RSI makes lower highs
These divergences provide early warning signs of potential trend reversals, allowing traders to prepare for significant market movements.
Advanced traders often combine multiple strategies, adapting their approach based on market conditions. The key is to develop a flexible trading system that incorporates:
- Multiple technical indicators
- Rigorous risk management
- Continuous market analysis
- Psychological discipline
Remember that no single strategy guarantees success. Continuous learning, practice, and adaptability are crucial in navigating the complex gold trading landscape. Traders should always use stop-loss orders, manage their risk carefully, and avoid overcommitting to any single trading approach.
Tips for Beginners in Gold Trading
Entering the world of gold trading can be both exciting and challenging for newcomers. Success requires a strategic approach, continuous learning, and a solid understanding of technical indicators and market dynamics.
Essential Technical Indicator Knowledge
For beginners, mastering fundamental technical indicators is crucial. According to Investopedia, several key indicators can help traders make informed decisions:
Relative Strength Index (RSI)
The RSI is a momentum oscillator that ranges from 0 to 100. When the RSI moves above 70, it suggests an overbought market condition, indicating potential price correction. Conversely, an RSI below 30 suggests an oversold market, presenting potential buying opportunities.
Moving Averages
Simple Moving Averages (SMA) and Exponential Moving Averages (EMA) help smooth price data and identify market trends. Beginners can use these indicators to understand price momentum and potential trend directions. Crossovers between short-term and long-term moving averages can signal potential trading opportunities.
Risk Management Strategies
Successful gold trading goes beyond understanding technical indicators. Effective risk management is paramount for beginners. Key strategies include:
- Setting strict stop-loss orders
- Never risking more than 1-2% of total trading capital on a single trade
- Diversifying trading approaches
- Maintaining emotional discipline
Discover advanced support and resistance techniques to enhance your trading skills.
Practical Learning and Continuous Improvement
The Moving Average Convergence Divergence (MACD) is another critical indicator for beginners. Investopedia research highlights its importance in identifying potential trend changes. A bullish signal occurs when the MACD line crosses above the signal line, while a bearish signal is indicated when it crosses below.
Beginners should focus on:
- Practicing with demo trading accounts
- Studying market trends and historical price movements
- Learning from experienced traders
- Keeping a trading journal to track and analyze performance
Additionally, staying informed about global economic events, geopolitical situations, and market sentiment can significantly impact gold prices. Continuous education and adaptability are key to long-term success in gold trading.
Remember, no single strategy guarantees success. Trading is a skill developed through patience, practice, and a willingness to learn from both successes and failures. Start small, manage your risks carefully, and gradually build your trading confidence and expertise.
Frequently Asked Questions
What are the top technical indicators for gold trading?
The top technical indicators for gold trading include the Relative Strength Index (RSI), Moving Average Convergence Divergence (MACD), and Money Flow Index (MFI). These tools help traders analyze market trends and make informed decisions.
How can traders effectively combine multiple indicators for gold trading?
Traders can effectively combine multiple indicators by looking for convergence and divergence between signals. For example, using RSI and MACD together can enhance the accuracy of entry and exit points, allowing for more reliable trading signals.
What is the significance of the RSI in gold trading?
The Relative Strength Index (RSI) is significant in gold trading as it measures momentum, identifying whether the market is overbought (RSI above 70) or oversold (RSI below 30). This helps traders make informed decisions regarding potential market reversals.
How important is risk management in gold trading?
Risk management is crucial in gold trading. Traders should set strict stop-loss orders and ensure they only risk 1-2% of their total capital on any single trade. This approach helps protect against significant losses in a volatile market.
Turn Gold Trading Knowledge Into Profitable Signals with Proven Tools
You have learned how powerful technical indicators like RSI, MACD, and MFI can transform your gold trading accuracy in 2025. But recognizing the best setups is only half the battle. Many traders struggle to filter out false signals and often miss out on high-probability trades. If you are determined to improve your results and want confident decision-making, it is time to use signals powered by deep market analysis and real-time strategies.
Explore expert-driven guidance in our How To Guides
Join our Private Telegram Group for access to daily, real-time XAU/USD gold trading signals that integrate technical indicators and market context, all designed to help you maximize profits and reduce costly mistakes. Our signals consistently deliver a 90 percent plus win rate, no matter your experience level. Do not wait until the next trend passes you by. Sign up at https://xau-gold-signals.com and start capitalizing on gold trading opportunities today.